Several months ago at SMX advanced in Seattle, Rand Fishkin of SEOMOZ did a presentation on Google Vs Bing Correlation of Ranking Factors. Since then, I’ve seen these charts and data surface on several SEO blogs, forums, and chat rooms – and every time I see them being used to backup some crackpot theory I cringe.
While I applaud Rand and SEOMOZ for attempting to bring science to the SEO community, sometimes I think they try to stretch that science too far – and this article is one of those cases.
The bit about explaining the difference between correlation and causation is spot on, but unfortunately the rest of the article is completely irrelevant bullshit. There’s nothing wrong with the data or how they collected it, it’s just that none of the data is significant enough to warrant publishing. None of it tells us anything.
The problem here is that most people using this data to support their claims have no idea what correlation coefficients are, let alone how to interpret them. Correlation coefficients range from -1 to 1. If two factors have a coefficient of 0, that means they are in no way related whatsoever. If the coefficient is 1, it means they’re positively correlated. That is to say, as one increases so does the other. For example. The amount of weight I gain is positively correlated to the amount of food I eat. A person’s income is positively correlated to their level of education.
Negative correlation is the opposite. It implies that two things are oppositely related. For example a student’s sick days and grades are negatively correlated – meaning that the more school a child misses the worse his grades are.
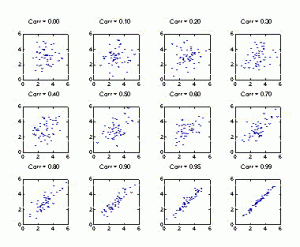
If you were to graph points on an X,Y coordinate system, the graph would look more and more like a straight line as the correlation numbers approach 1 or -1. Here’s a quick graph of some correlation coefficients:
The problem is that the SEOMOZ article (and several SEOs) doesn’t properly interpret the correlation coefficients and what they signify. Let’s take a look:
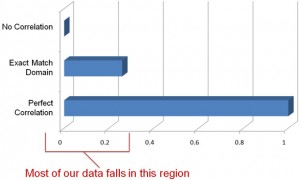
By SEOMOZ’s own admission, most of their data has a correlation coefficient of about 0.2 – but what does that mean? In scientific terms a 0.2 correlation means that these things aren’t really related at all. That means most of the SEOMOZ data is pretty meaningless.
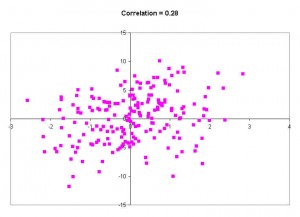
To further illustrate, here’s what a graph of a .28 correlation coefficient looks like. (note, this is a higher correlation that most of the SEOMOZ data)
These numbers are all over the place – there’s no pattern and there’s certainly no trend. I could draw several different trend lines on this data that all tell different stories. In other words, the data isn’t related and can’t be used to prove anything. There’s no real correlation here at all. .28 is too close to zero to be signficiant.
When factors have a correlation coefficient this small it usually means there’s some sort of anecdotal relationship, but nothing worth publishing or reporting. And this is just the random example I picked. When they start talking about ALT attributes having a correlation of 0.04 it just gets crazier. There’s nothing statistically valid to be learned about data with coefficients between 0 and .1.
To be honest, I wouldn’t base any decisions on the data unless it had a correlation coefficient of around .45 or higher.
http://thehistoryhacker.com/2013/08/ There’s a few other issues too.
One of the charts mentions that .org domains have better ranking than .com domains. That’s great for sites (like seomoz.org) that have a .org in their name, but is it really true? When you look at the data two things stick out here. First, Wikipedia is a .org and ranks well for many terms. In fact, it ranks so well that it probably should have been considered an outlier and discarded. Second, the data doesn’t include what they call “branded terms” – but a vast majority of .com domains are in fact brands. Having done SEO for several fortune 500 clients I can tell you that big brands mostly target branded terms. That has to make an impact on the data.
And that’s part of the problem in SEO. In addition to collecting the data, we have to sell stuff. Often it’s way too easy to present the data in a way that helps us sell the narrative we want. I’m not out to get SEOMOZ, and I don’t have any problems with them. I actually admire them, because at least they’re collecting data. That’s way more than many others are doing. Collecting data is just the first step though. The real magic happens when you properly apply the data.
Let’s face it. The SEO community isn’t very scientific. We tend to believe anything Matt Cutts, SEOMOZ, or Danny Sullivan say as gospel truth. But should we? Sure they have great reputations but sometimes they make mistakes too. (Remember when several SEOs sold pagerank sculpting services even though now we know it never worked?) I’m not a very religious man so I tend to take everything with a degree of skepticism – and I think that’s the approach more people in the community should use. We need more posts like the SEOMOZ one I linked above, but we also need more people willing to question the data and run tests of their own too. I know we get enough scrutiny from those outside of SEO, but that’s because we don’t get enough scrutiny from those inside the community. Only then will people start taking SEO more seriously.
Disclaimer: The views in this post are mine, and mine alone. I’ve said that a million times before but I just wanted to repeat that here.


Hey Ryan,
Thanks for this post. I’m not a math expert so please clarify if I’m wrong about this, but isn’t the -1 to 1 scale based on how well something correlates to actual ranking? So, due to the 200+ ranking factors, it is literally impossible for any 1 factor to have a 1 score on the scale – thus making something like a .17 correlation score actually pretty strong when we’re looking at it on a 200+ factor algorithm.
Please clarify.
Ross
Comment by Ross Hudgens — September 17, 2010 @ 3:37 pm
I’m not sure that’s the case.
As explained in the SEOMOZ post, (and perhaps they can clarify) the factors are to how well the sites rank, not to that factor as compared to other factors.
I don’t think it’s the case where every factor is taken independent of all other factors (as that would pretty hard to do)
Comment by Ryan — September 17, 2010 @ 3:51 pm
Hi Ryan – while I very much agree that it’s good to be skeptical and that correlation studies can’t answer all the things we’d want, I think your article has some severe inaccuracies.
For example – standard error is used in correlation work to measure precision, which you can also think about as “the chance of meaningfulness or meaninglessness.”
In your weight gain/food example, the quantity of calories you consume, the types of calories, genetic features of you yourself, your daily expended energy and many other factors all contribute to the weight gained or lost. Many of these will show correlation numbers that are most certainly not 1.0 (probably plenty of them will be in the 0.1-0.3 range).
However, you can use standard error of the dataset to show the liklihood that correlation is wrong and you can use different inputs to compare their relative importance.
Thus, if you examined a very large number of people (thousands) and saw that eating foods high in iron but low in calcium had a correlation of 0.15 with weight gain but that the reverse showed a negative correlation of 0.05, you could reasonably make the conclusion that, barring some interfering/obscuring metric (correlation =! casuation, etc.), eating high iron/low calcium foods would be worse for those seeking to lose weight.
This is pretty much the process we use with SEO analyses and correlation data. Since we gather thousands to tens of thousands of results, we can feel reasonably confident that correlations are non-zero and compare the various impacts against one another. Keyword in the title tag is very small, while # of linking root domains is relatively large. As Ross points out, no single factor we’ve ever examined has a correlation of higher than 0.35, and in a 200+ ranking factor model, that’s precisely what one would expect.
Feel free to ping me if I can be of more help as I’ll be on the road the next couple weeks and may not get a chance to jump back in here.
Thanks for bring up the topic!
Comment by randfish — September 17, 2010 @ 4:18 pm
Hey Rand. Thanks for stopping by. I’m not 100% sure if standard error can be used in that way. I’ve always thought it was just an estimate of the fuzziness of the data and couldn’t be used to “change the scale of correlation”
I could be wrong though. I stopped 4 classes away from adding a math major to my computer science one, and It’s been a LONG time.
can somebody who’s confident in their statistics chime in here?
I apologize for dragging SEOMOZ through the mud here. I started off complaining about people basing stupid decisions on that post (which I see often) but didn’t want to out the small time shops who might not be big enough to take the criticism.
Comment by Ryan — September 20, 2010 @ 10:09 am
Ryan,
I think this is one of the most intelligent posts on anything SEO I’ve seen. Granted, I’m not an SEO guy so I haven’t seen as many as a lot of your readers. But I am a physicist and have done statistical analysis on other types of data.
You’re right about the corellation coefficient. But I think Rand is right too about standard error. While there may be hundreds of contributing factors, you have to consider them as independent or dependent variables. I agree with Rand jumping on you a little about the weight loss analogy. True, eating more is probably strongly correlated with gaining weight, but that isn’t the only dependent variable to gaining weight. What you eat, and not exercising could also be variables, etc, etc.
And maybe there’s not much significance between a coefficient of 0.05 and 0.10 for some bodies of data, but what if you’re looking at 10,000 data points vs. 200? Then is that difference more significant? If I remember correctly, standard error is a product of sample size. But I could be confused. I often am.
Anyway, great and intelligent post. I just bookmarked you and am planning on reading a lot more of your stuff.
Cheers,
Matt
Comment by Matt — September 23, 2010 @ 5:26 pm
HI, there:
In order to know if a correlation coefficient is statistically significant and different from zero we need to do a two-tail t-test at a given sample size and confidence level, as described at this link
http://irthoughts.wordpress.com/2010/10/18/on-correlation-coefficients-and-sample-size/
If the correlation coefficient is not statistically different from zero (null hypothesis is not rejected), the correlation between the two variables at hand is not significant either.
Cheers
Comment by egarcia — October 19, 2010 @ 2:07 pm
“And maybe there’s not much significance between a coefficient of 0.05 and 0.10 for some bodies of data, but what if you’re looking at 10,000 data points vs. 200? Then is that difference more significant?”
Statistical significance not necessarily equate to high correlation. Actually, for large enough sample size ANY correlation coefficient value become statistical significant, even those as small as 0.01, 001, etc., so using a huge sample to force very small r values to be come statistical significance proves nothing.
Second, correlation coefficients (Pearson, Spearman, Kendall, etc) are not additive, so arithmetic means are not computable out of these. Accordingly, their standard error implementation is incorrect. To compute all that they need to computed weighted means, not arithmetic means.
Comment by egarcia — December 1, 2010 @ 9:00 pm